Drought indicator charts
Climate
Risk
Water
View drought intensity data and charts for your region. Updated monthly.
View drought intensity data and charts for your region. Updated monthly.
View maps showing average soil moisture deficit onset and termination dates across New Zealand.
See how recent rainfall in your rohe compares to historic records - a useful indicator for drought planning.
The SPI measures drought and wet conditions using recent rainfall data.
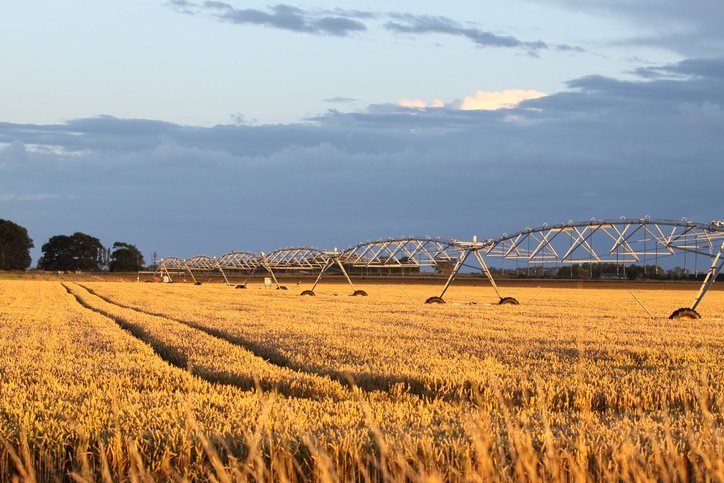
View soil moisture levels and drought indicators across the motu.
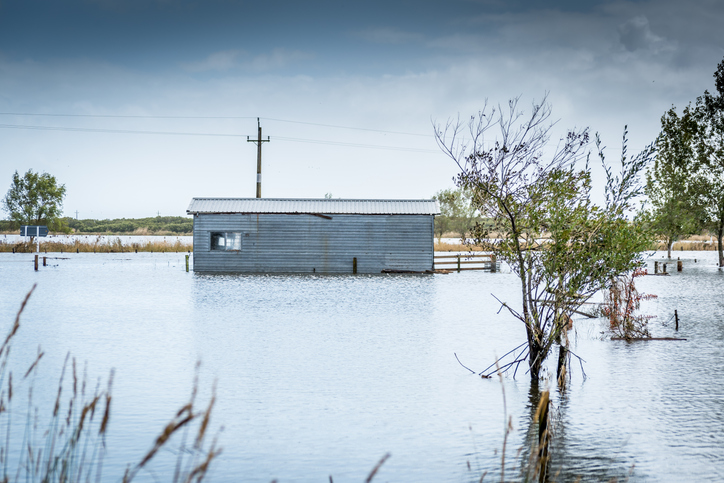
Explore coastal flood maps to assess the potential impacts of sea-level rise in your rohe.
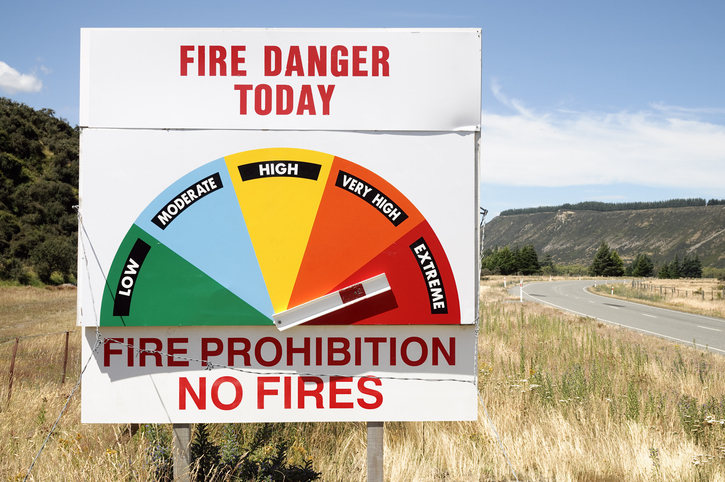
Access fire risk maps and forecasts, plus key weather data for Aotearoa's regions.
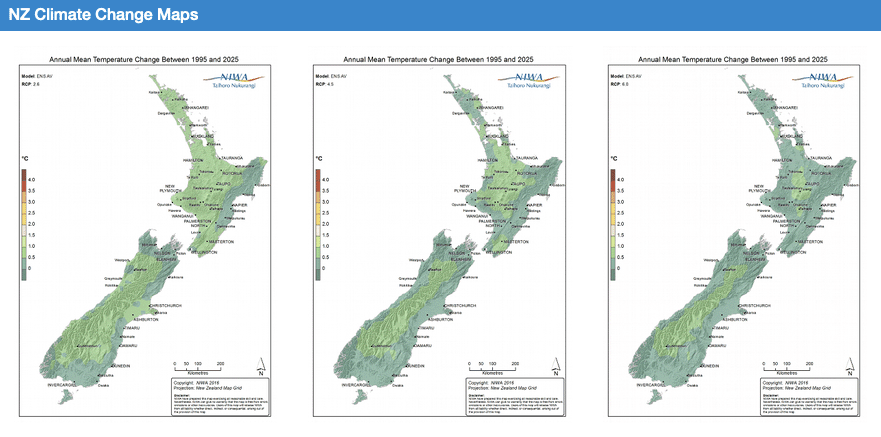
Explore how climate change will impact New Zealand's weather and environment over the coming century.
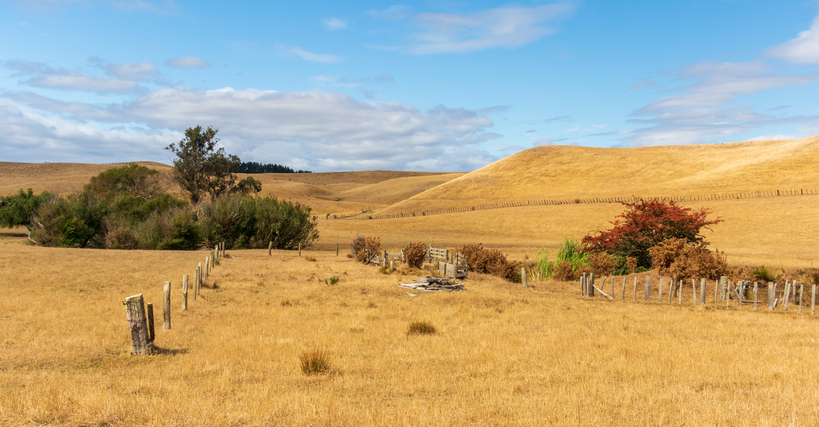
The NIWA Drought Forecasting Dashboard helps farmers track drought risk and rainfall for the next 35 days for better planning and decision-making.