Our Future Climate New Zealand - NZ Climate Change Maps
Climate
Adaptation
Risk
Sustainability
Explore projected temperature and rainfall changes for Aotearoa online.
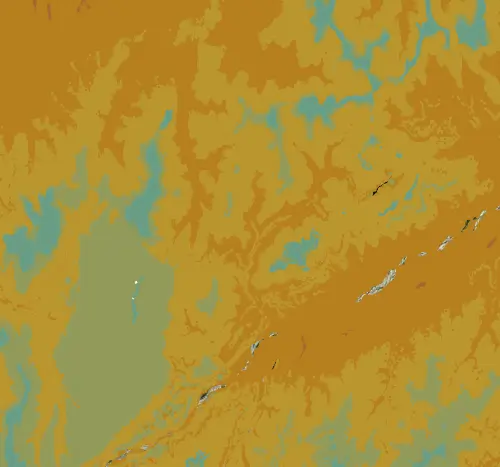
This map shows the average annual temperature across New Zealand in fine detail -- down to 25-metre resolution. That makes it especially useful for hilly or mountainous country where temperature changes a lot with altitude over short distances.
The underlying weather data covers 1950 to 1980, so the overall temperature patterns are still broadly right, but absolute values may not reflect recent warming.
The high resolution makes this a good layer for understanding how the climate has changed in your rohe, and also for comparing temperatures across your own whenua, especially if it has a mix of ridgeline and valley floor.
Data sourced from Manaaki Whenua Landcare Research licensed under CC BY 4.0.
Explore projected temperature and rainfall changes for Aotearoa online.
This resource details temperature changes in New Zealand and health risks linked to extremes.
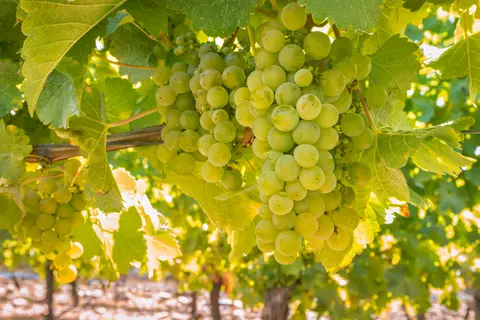
Find out how well Sauvignon blanc grapes could grow in your rohe by 2050 as the climate changes.
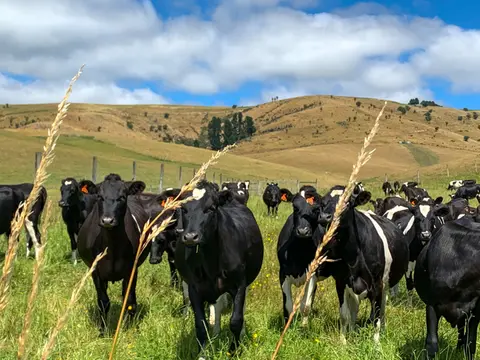
See how many hot days dairy cows in your rohe could face as the climate warms.
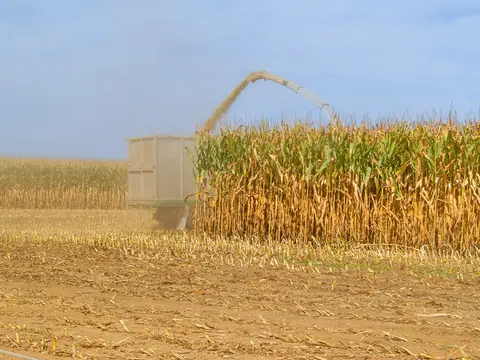
Find out how often heat stress could hit maize in your rohe as the climate changes.
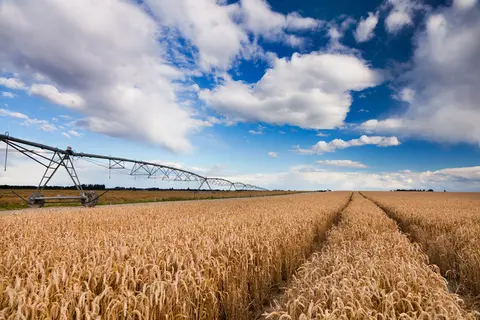
Check how often heat stress could hit wheat in your rohe as the climate changes.
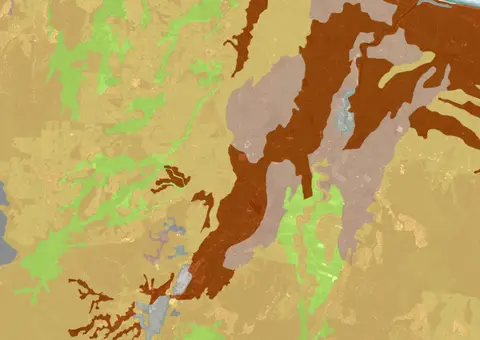
A dataset that estimates soil temperature across the motu.
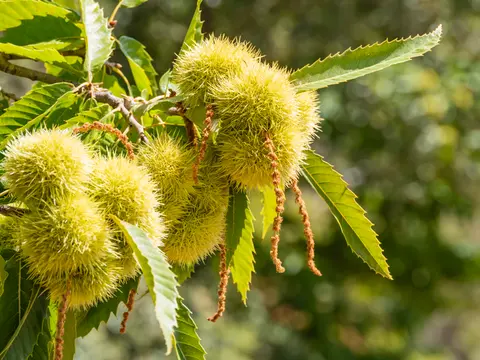
See how often frost and heat could threaten chestnuts in your rohe as the climate changes.
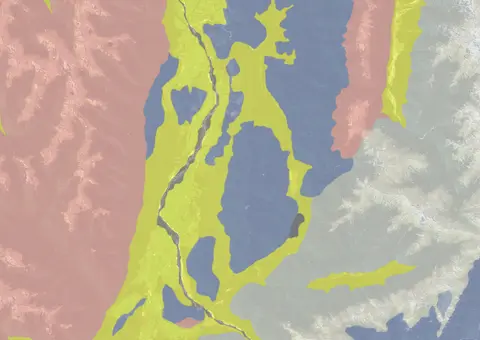
Use the NZLRI rock dataset to understand what type of rock is under your whenua.
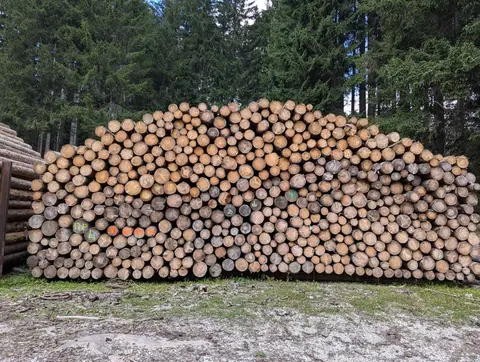
Check current and historic indicative radiata pine log prices by grade.
Get expert advice to improve your business planning and achieve your goals.
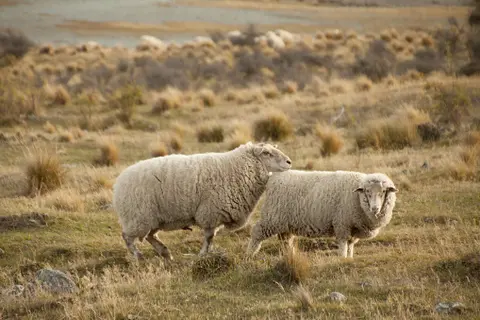
See how haemonchosis risk for your livestock could shift as the climate changes.
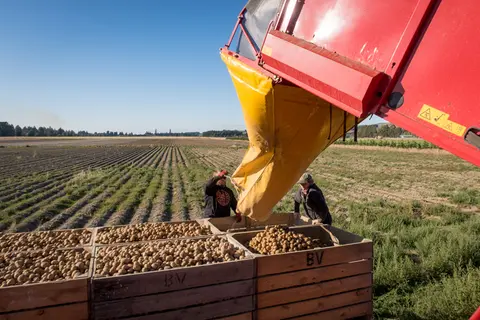
Learn how heat and frost risks for potatoes in your rohe could change over time.
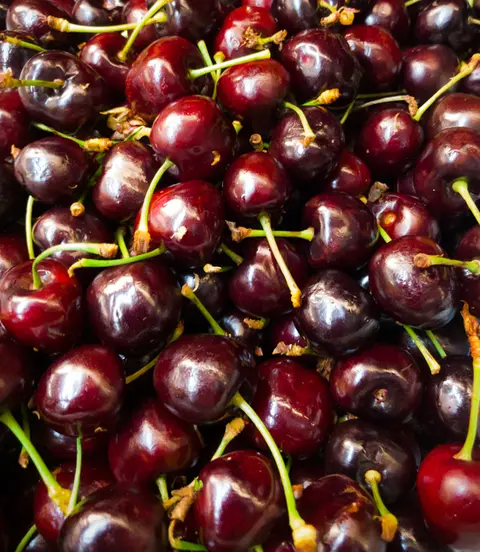
Explore how well cherries could grow in your rohe by 2050 as the climate changes.
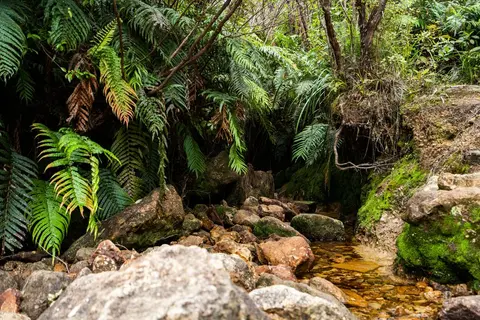
View historic indigenous forest cover in Te Ika a Māui based on a range of different data and imagery.
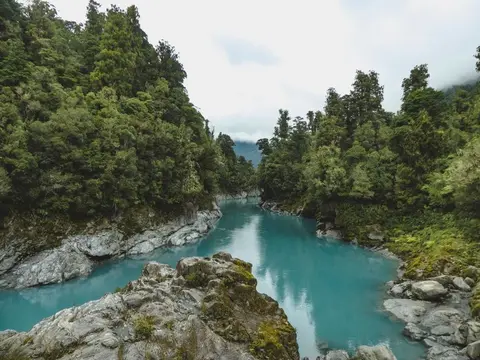
View historic indigenous forest cover in Te Wai Pounamu based on a range of different data and imagery.
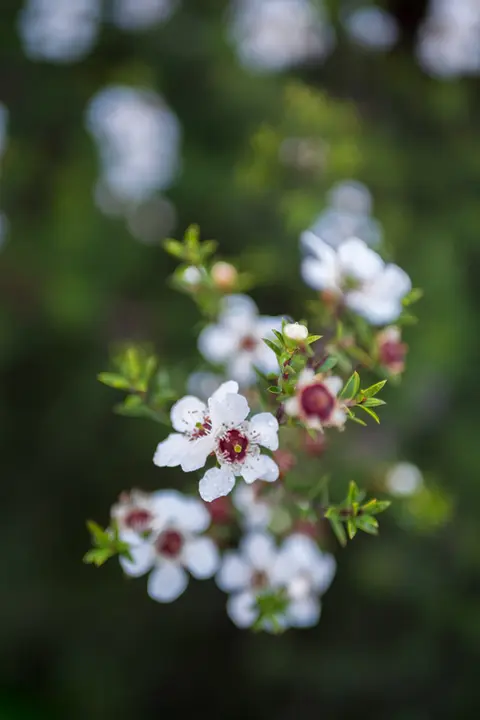
Check how well suited the whenua in your rohe is to producing mānuka honey.
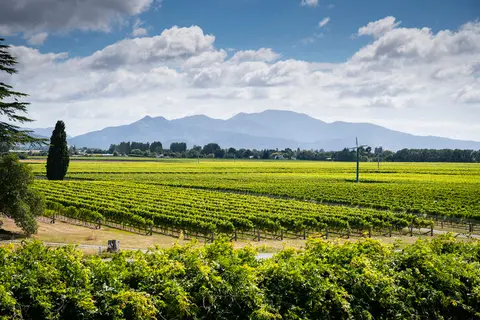
Explore how much growing season warmth your rohe could have by 2050.
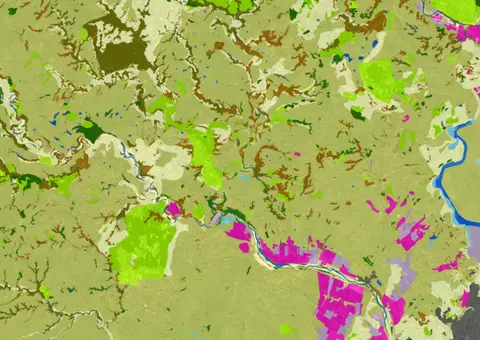
LUCAS is a national dataset that tracks carbon sequestration and land use change over time.
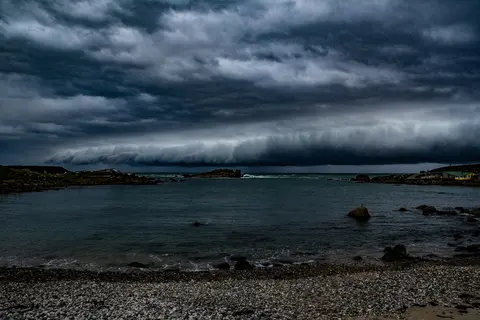
See different climate change scenarios for New Zealand and their potential impacts.
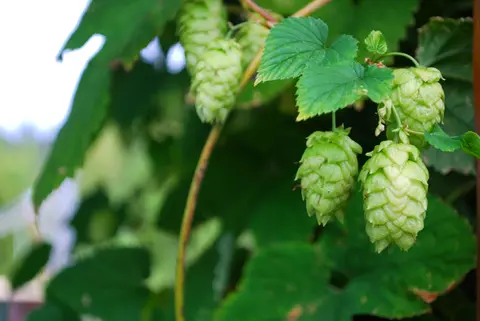
Discover how well suited the whenua in your rohe is to growing hops.
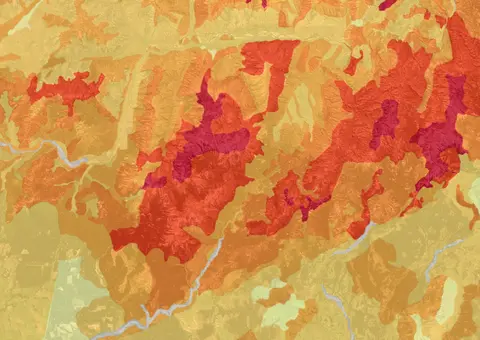
This map shows erosion types and estimated severity across Aotearoa.
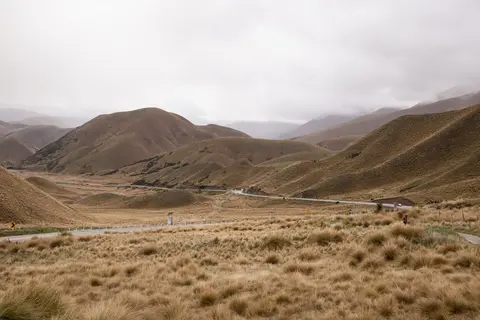
Find out how pasture growth on your land could change as the climate warms.