Our Future Climate New Zealand - NZ Climate Change Maps
Climate
Adaptation
Risk
Sustainability
Explore projected temperature and rainfall changes for Aotearoa online.
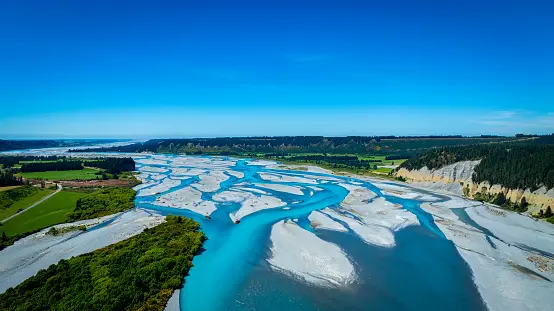
This table gives modelled trends in six key water indicators by region across Aotearoa, if the climate keeps warming at a high rate.
The indicators come from a hydrological model that tracks how water moves through snow, plants, soil, and into lakes and rivers, giving figures for river flow and evaporation from the land. It does not account for irrigation, water takes or dams.
NIWA built the figures with the TopNet hydrological model, run on a national grid at roughly 5 kilometre resolution.
Explore projected temperature and rainfall changes for Aotearoa online.
Find out how much drier your pasture could get by 2050 as the climate changes.
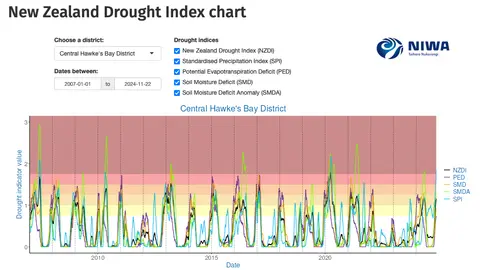
Monitor drought in New Zealand using key indicators and climate data. Access maps and downloads.
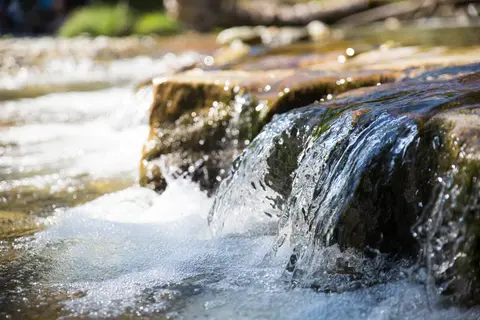
This research examines how climate change is likely to affect river flows in Aotearoa.

Read NIWA's full technical report on Northland's climate out to 2090.
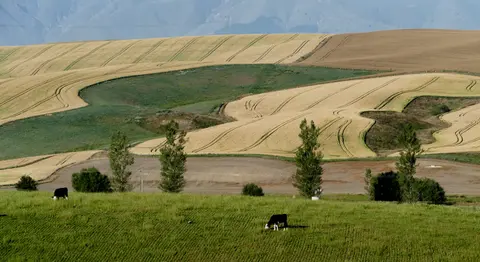
See how water shortfalls under maize could change as the climate warms.
Explore sea-level rise projections for your coastline out to 2300.
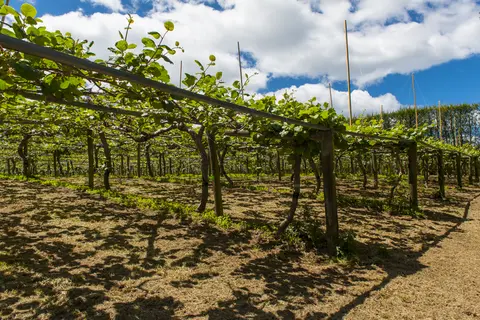
Learn how well kiwifruit could grow in your rohe by 2050 as the climate changes.
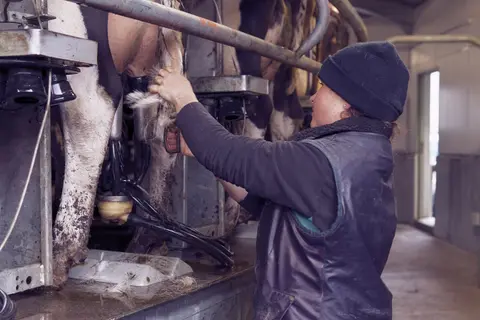
See what dairy farming earns, costs and pays in wages on land suited to it in your rohe.
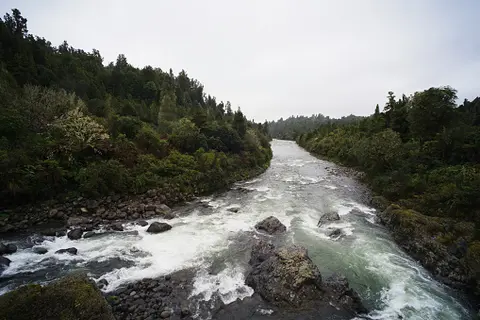
Compare nitrogen and phosphorus levels in your rivers against national bottom lines.
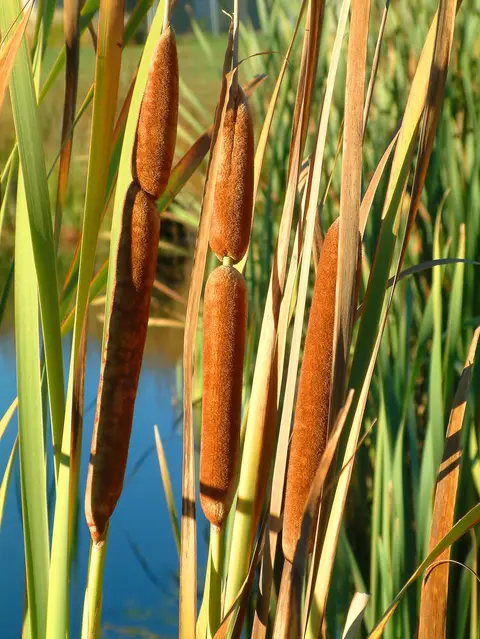
An interactive key to identify different wetlands that can be found in Aotearoa.
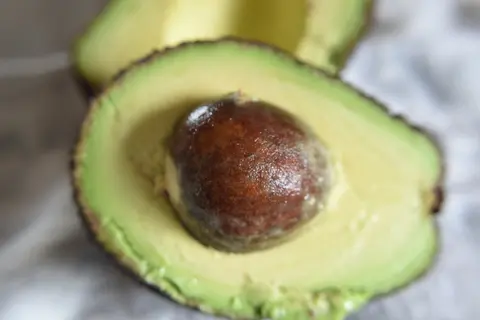
Find out how well avocados could grow in your rohe by 2050 as the climate changes.
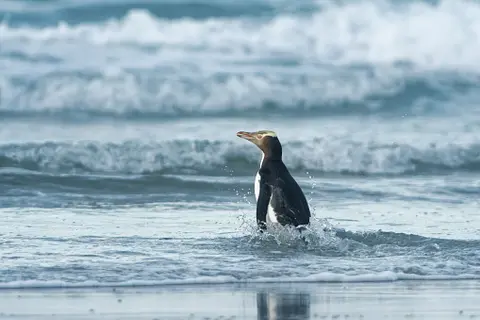
Find data on how climate change affects water in Aotearoa’s rivers and groundwater.
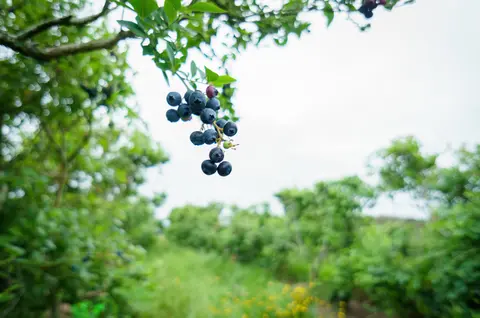
Discover how well blueberries could grow in your rohe by 2050 as the climate changes.
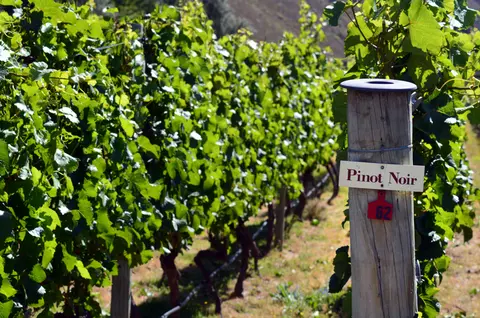
See how well Pinot noir grapes could grow in your rohe by 2050 as the climate changes.
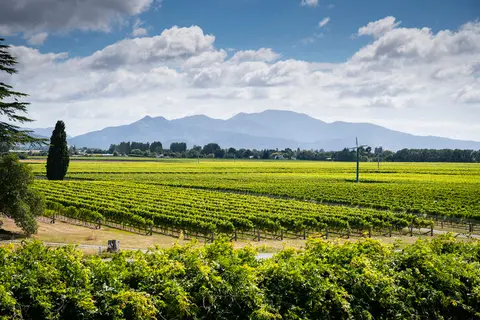
Explore how much growing season warmth your rohe could have by 2050.
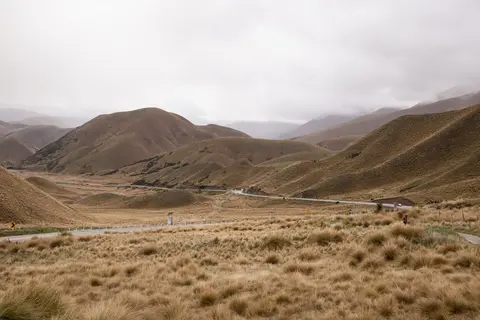
Find out how pasture growth on your land could change as the climate warms.
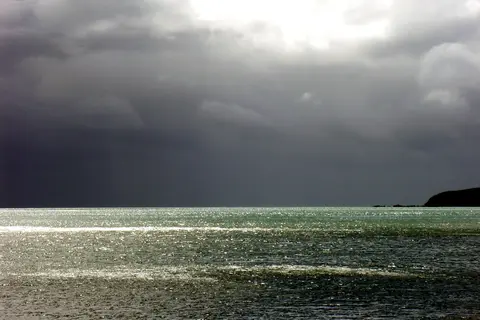
Compare rainfall, frost and dry-spell patterns across Te Matau-a-Māui Hawke's Bay.
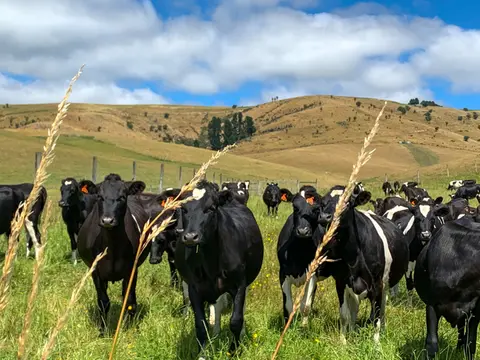
See how many hot days dairy cows in your rohe could face as the climate warms.
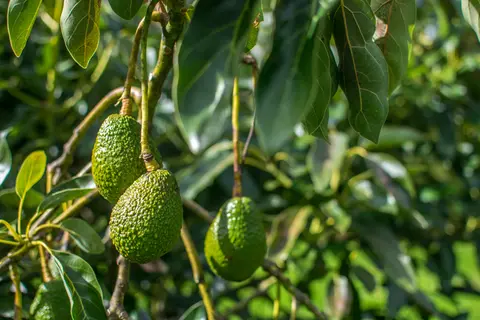
Find out how well suited the whenua in your rohe is to growing avocados.
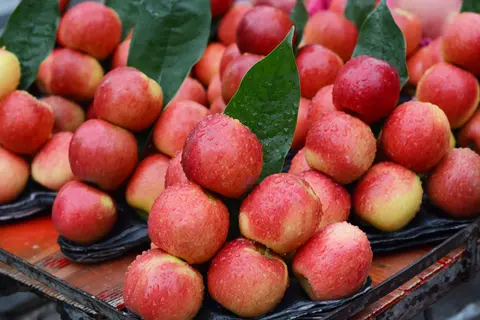
See how well apples could grow in your rohe by 2050 as the climate changes.
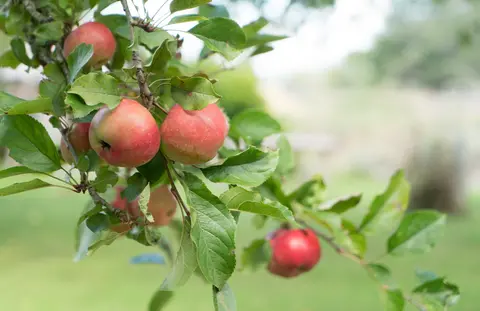
See how well suited the whenua in your rohe is to growing apples.
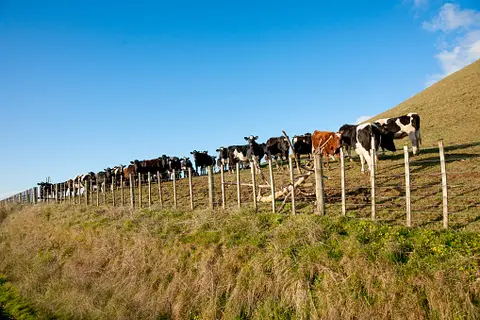
This research analyses future drought risks due to climate change impacts.